[1]:
import logging

import matplotlib.pyplot as plt
import numpy as np
import optimistix as optx
from jaxmod.units import unit_conversion

from atmodeller import (
    ChemicalSpecies,
    EquilibriumModel,
    Planet,
    SolverParameters,
    SpeciesNetwork,
    debug_logger,
)
from atmodeller.eos import get_eos_models
from atmodeller.solubility import get_solubility_models

logger = debug_logger()
logger.setLevel(logging.INFO)
# For more output use DEBUG
# logger.setLevel(logging.DEBUG)
Atmodeller initialized with double precision (float64)
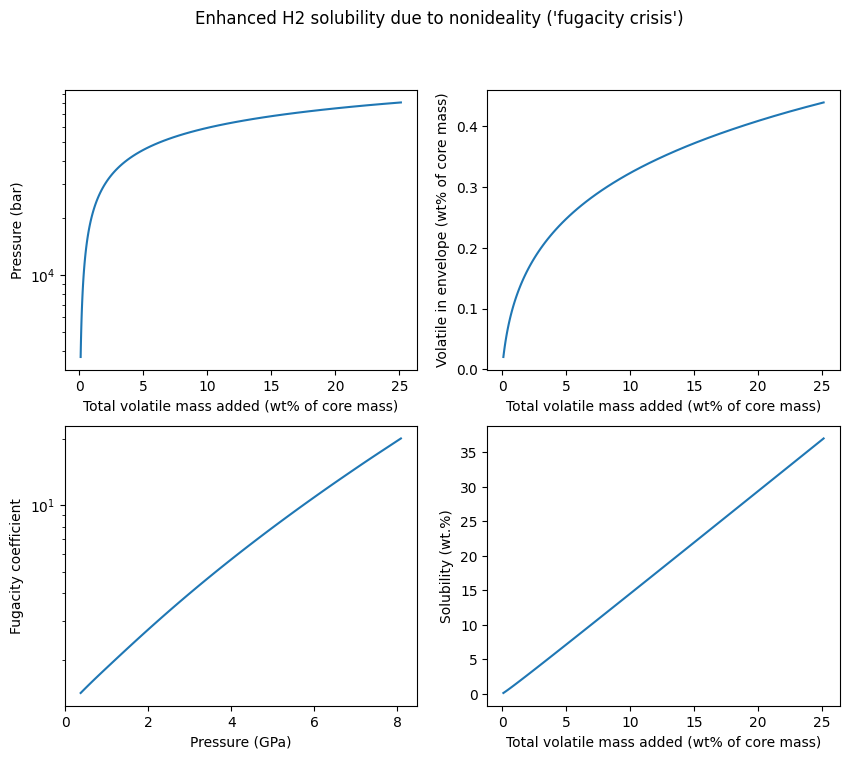
“Fugacity crisis”
The “fugacity crisis” (Kite et al., 2019) arises due to the enhanced solubility of H2 at high pressure and temperature due to its fugacity increase that is driven by its nonideal behaviour.
[2]:
surface_temperature = 3000.0  # K

eos_models = get_eos_models()
solubility_models = get_solubility_models()

H2_g = ChemicalSpecies.create_gas(
    "H2", solubility=solubility_models["H2_kite19"], activity=eos_models["H2_chabrier21"]
)

species = SpeciesNetwork((H2_g,))
model = EquilibriumModel(species)

# Kite uses a 4 Earth mass planet for Figure 2 in Kite et al. (2019)
scale_earth: float = 4
planet: Planet = Planet(
    planet_mass=5.972e24 * scale_earth, core_mass_fraction=0.333, temperature=surface_temperature
)
[19:34:07 - atmodeller.classes             - INFO     ] - species_network = ('H2_g: CombinedRealGas, _H2_chachan18',)
[19:34:07 - atmodeller.classes             - INFO     ] - Thermodynamic data requires temperatures between 200 K and 20000 K
[19:34:07 - atmodeller.classes             - INFO     ] - reactions = {}
[3]:
# Volatile mass fraction relative to the total mass of the rocky part of the planet
zeta_v = 10 ** np.linspace(-3, -0.6, 100)
mass_hydrogen = planet.planet_mass * zeta_v

solver_parameters = SolverParameters(solver=optx.LevenbergMarquardt)
model.solve(
    state=planet, mass_constraints={"H": mass_hydrogen}, solver_parameters=solver_parameters
)

# Get and process the output
output = model.output
output_df = output.to_dataframes()
[19:34:47 - atmodeller.classes             - INFO     ] - Solve (robust) complete: 100 (100.00%) successful model(s)
[19:34:48 - atmodeller.classes             - INFO     ] - Multistart summary: 100 (100.00%) models(s) required 1 attempt(s)
[19:34:48 - atmodeller.classes             - INFO     ] - Solver steps (max) = 35
[19:34:48 - atmodeller.output_core         - INFO     ] - Computing to_dataframes output
[19:34:48 - atmodeller.output_core         - INFO     ] - Computing asdict output
[4]:
fig, axes = plt.subplots(2, 2, figsize=(10, 8))

volatile_mass_added = zeta_v * 100
pressure = output_df["state"]["pressure"]
pressure_GPa = pressure * unit_conversion.bar_to_GPa
fugacity_coefficient = output_df["H2_g"]["fugacity_coefficient"]
dissolved_ppmw = output_df["H2_g"]["dissolved_ppmw"]
dissolved_wtp = dissolved_ppmw * 1e-4  # to wt%
atmosphere_mass = output_df["H2_g"]["gas_mass"]

ax = axes[0, 0]
ax.plot(volatile_mass_added, pressure)
ax.set_yscale("log")
ax.set_xlabel(r"Total volatile mass added (wt% of core mass)")
ax.set_ylabel("Pressure (bar)")

ax = axes[1, 0]
ax.plot(pressure_GPa, fugacity_coefficient)
ax.set_yscale("log")
ax.set_xlabel("Pressure (GPa)")
ax.set_ylabel("Fugacity coefficient")

ax = axes[1, 1]
# Plot solubility as wt%
ax.plot(volatile_mass_added, dissolved_wtp)
ax.set_xlabel(r"Total volatile mass added (wt% of core mass)")
ax.set_ylabel("Solubility (wt.%)")

ax = axes[0, 1]
y = atmosphere_mass / planet.planet_mass * 100  # pyright: ignore
ax.plot(volatile_mass_added, y)
ax.set_xlabel(r"Total volatile mass added (wt% of core mass)")
ax.set_ylabel(r"Volatile in envelope (wt% of core mass)")

fig.suptitle("Enhanced H2 solubility due to nonideality ('fugacity crisis')")

plt.show()